Grouping Elasticsearch slow log queries
Elasticsearch provides the ability to log slow search queries that exceed a certain threshold. When enabled, all the search queries that exceed the given threshold are written to /var/log/elasticsearch/${cluster_name}_index_search_slowlog.log. A typical line in the slow log file looks like
[2017-09-10T12:35:53,355][WARN ][index.search.slowlog.fetch] [GOgO9TD]
[testindex-slowlogs][0] took[150.6micros], took_millis[0], types[],
stats[], search_type[QUERY_THEN_FETCH], total_shards[5],
source[{\"query\":{\"match\":{\"name\":{\"query\":\"Nariko\",\"operator\":\"OR\",\"prefix_length\":0,\"max_expansions\":50,\"fuzzy_transpositions\":true,\"lenient\":false,\"zero_terms_query\":\"NONE\",\"boost\":1.0}}},\"sort\":[{\"price\":{\"order\":\"desc\"}}]}]
This information might be enough for simple use cases. But if one operates at scale and if the system is used by multiple teams with wildly different queries, then manually going through every line is not possible.
A simple solution is to parse the text into structured data which can
be then ingested into a centralized logging system like Graylog or ELK.
{
                 "node" => "GOgO9TD",
                "shard" => 0,
               "source" => '{"query":{"match":{"name":{"query":"Nariko","operator":"OR","prefix_length":0,"max_expansions":50,"fuzzy_transpositions":true,"lenient":false,"zero_terms_query":"NONE","boost":1.0}}},"sort":[{"price":{"order":"desc"}}]}',
                 "took" => "150.6micros",
                "stats" => "",
                "level" => "WARN",
             "@version" => "1",
                "index" => "testindex-slowlogs",
      "local_timestamp" => "2017-09-10T12:35:53",
           "@timestamp" => 2017-09-10T05:35:53.000Z,
                 "host" => "Ananthas-MacBook-Pro.local",
         "total_shards" => 5,
                "types" => "",
          "search_type" => "QUERY_THEN_FETCH",
          "took_millis" => 0
}
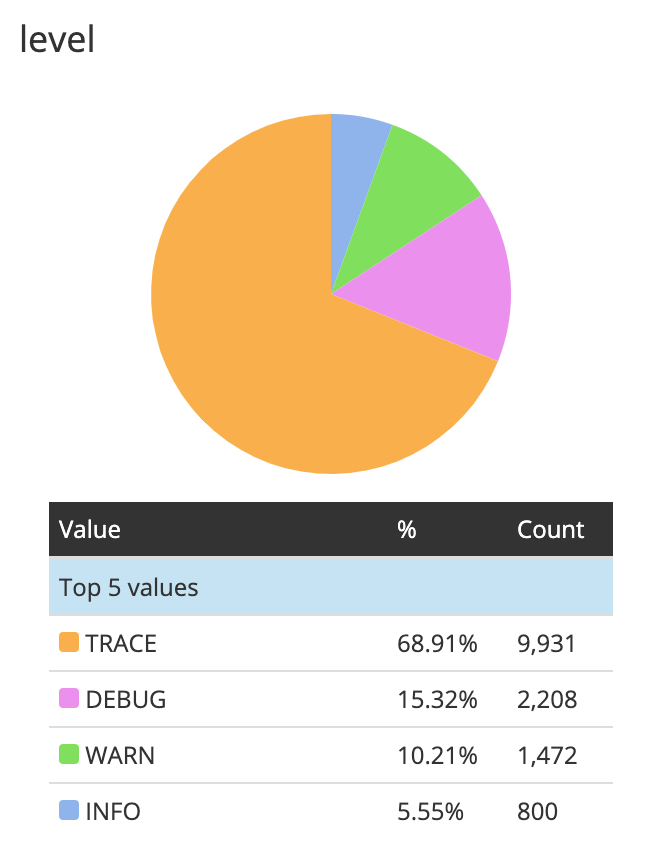
Now we can find queries that took more than 500 ms or group the logs
based on a field like level, etc. But there are still some cases
where this is not sufficient. Let say we want to see the top 10 slow
queries based on the count, we can't simply group based on the
source field. Even though the query structure will be the same, the
argument of each query operator might differ for each slow log. What
we might find useful is something like parameterized sql query, where
all the variables are represented as ?
{
    "source_normalized" => '{"query":{"match":{"name":{"boost":1.0,"fuzzy_transpositions":true,"lenient":false,"max_expansions":50,"operator":"OR","prefix_length":0,"query":"?","zero_terms_query":"NONE"}}},"sort":[{"price":{"order":"desc"}}]}'
    "source_id"         => "289972b28"
}
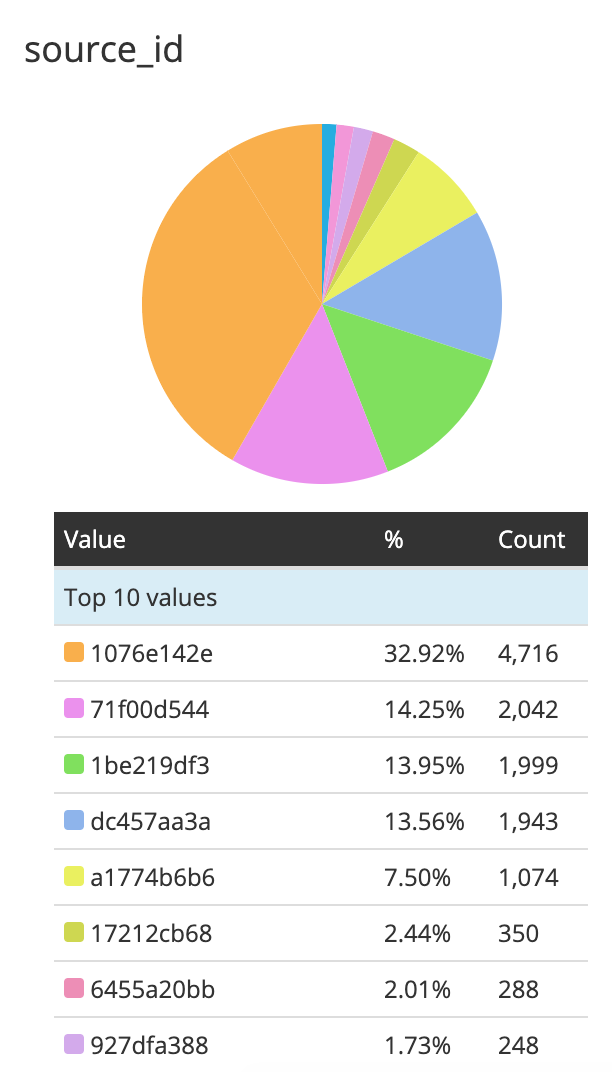
Once we have that, we could just take the hash of the source_normalized
field and group based on it. source_id is just the first 8 characters
of md5(source_normalized).
We have written a logstash
plugin which does exactly this. All you need to do is install the plugin and
add the filter configuration for slow log files.
filter {
  elasticsearchslowlog {
  }

  date {
    match => ["local_timestamp", "ISO8601"]
    timezone => "Asia/Kolkata"
  }
}